Enthalpy level diagrams.
- Enthalpy level diagrams are graphical representations used chemistry to portray the changes in enthalpy (ΔH) that occur during a chemical reaction.
- The term “enthalpy” refers to the total heat content of a system at constant pressure.
- The diagram illustrates the enthalpy levels of reactants and products, enabling us to readily visualise the energetics involved in a chemical process.
- It is a useful tool for understanding thermodynamics in chemical reactions, and it can offer insights into reaction mechanisms, activation energies, and the exothermic or endothermic nature of reactions.
- It shows us how the energy (enthalpy) of the chemicals change, without energy being created or destroyed. There is an exchange of energy between the chemicals and their surroundings.
[The First Law of Thermodynamics, also known as the Law of Energy Conservation, states that energy cannot be created or destroyed; it can only be transferred or converted from one form to another.] - In an exothermic reaction the products have less energy than the reactants.
The energy lost from the chemicals is transferred to the surroundings and they warm up. - In an endothermic reaction the products have more energy than the reactants.
The energy gained by the chemicals is transferred from the surroundings
and they cool down.
Components of an Enthalpy Level Diagram:
Reactants and Products: These are depicted by horizontal lines, typically labeled to signify the compounds involved. The vertical position of each line corresponds to its enthalpy level.
Transition State: If the diagram is representing a reaction mechanism, there may be a peak that represents the transition state, which is the point of maximum energy that the system must overcome for the reaction to occur.
Activation Energy (EA): This is the energy required to initiate the reaction and is represented by the difference in enthalpy between the reactants and the transition state. It is usually indicated by an arrow.
Enthalpy Change (ΔH): The difference in enthalpy between the products and reactants is the ΔH for the reaction. This value can be positive (endothermic reaction) or negative (exothermic reaction) and is often marked on the diagram.
Arrows: These are used to indicate the direction of the reaction and can be either unidirectional or bidirectional, depending on whether the reaction is irreversible or reversible. In the examples to right I have indicated reversible reactions.
What They Show:
Exothermic and Endothermic Reactions: An exothermic reaction releases energy, so the enthalpy level of the products will be lower than that of the reactants. Conversely, an endothermic reaction absorbs energy, so the enthalpy level of the products will be higher than that of the reactants.
Reaction Mechanisms: More complicated diagrams may show multiple steps of a reaction, each with its own transition state and activation energy. This can provide insights into the mechanistic details of the reaction.
Catalysts: If a catalyst is involved, it will lower the activation energy, and this will be depicted by a lower peak for the transition state.
Thermodynamic Feasibility: While the diagram can show if a reaction is exothermic or endothermic, it does not necessarily indicate whether the reaction will spontaneously occur. For that, other factors such as entropy and temperature must also be considered.
Thermodynamic and Kinetic Stability. Look at the diagrams labelled 1-4 to the right.
In 1 and 2 the reactants are “thermodynamically unstable”.
This is because the products have less enthalpy and are more stable.
The opposite is true of 3 and 4.
In 1 and 3 the reactants are “kinetically stable”.
This is because the activation energy is high.
The opposite is true of 2 and 4.Rate of Reaction: The diagram provides a visual illustration of the activation energy, which is directly related to the rate of the reaction. A higher activation energy generally corresponds to a slower reaction rate.
In summary, enthalpy level diagrams serve as valuable educational and analytical tools for understanding the energy profiles of chemical reactions. They condense complex thermodynamic concepts into an easily interpretable visual format, assisting both in academic settings and in practical applications such as industrial process optimization.


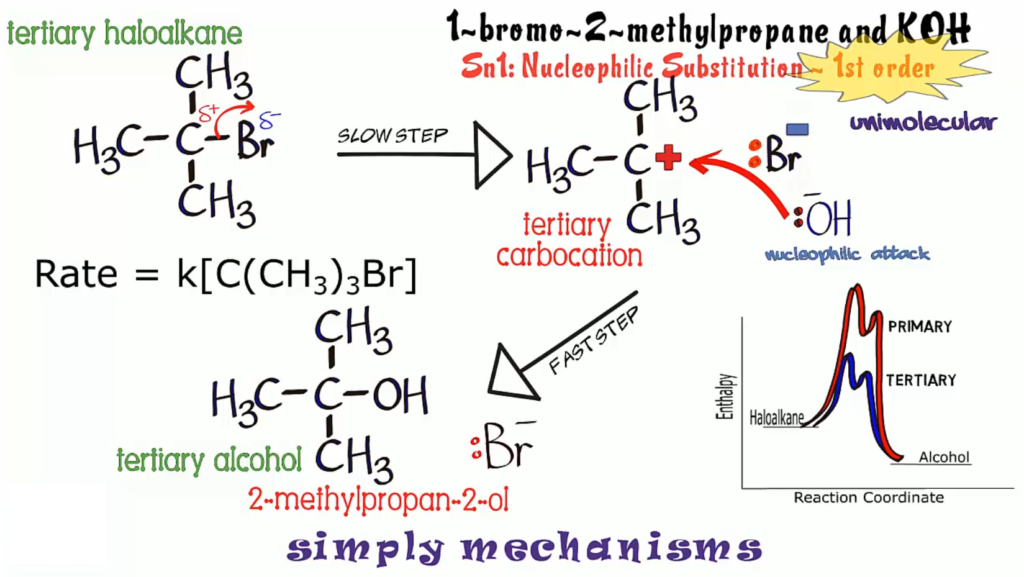
Enthalpy level diagram for a 2-step organic mechanism.

⇓ An example of such a 2-step reaction is the reaction of a tertiary halogenoalkane with aqueous hydroxide ions ⇓